Filter
Hide nodes that don’t match. Filtered-out nodes and their edges disappear — not dim, actually gone.
Filtering is how you reduce visual noise to what matters. Every property on every node is filterable, with a UI tailored to its type. Multiple filters stack with AND semantics. The result is a live view that updates as you adjust controls, with edges from/to hidden nodes culled automatically.
The difference from Search matters: filter carves the view (hidden means gone), search highlights within it (non-matches dim, stay in place). You typically filter first to carve, then search to find.
Per-type UI
Section titled “Per-type UI”Knotviz gives each property type a dedicated control, because filtering a numeric range is fundamentally different from picking categorical values.
| Property type | Control |
|---|---|
number | Dual-handle range slider with min/max inputs. Histogram overlay + three scale modes (see below). |
string / string[] | Searchable multi-select with chip display. Select-all / clear-all / reset shortcuts. |
boolean | True / False radio. Disable the filter to include both. |
date | Dual-handle range slider with ISO-formatted endpoints. Histogram overlay + three scale modes (see below). |
Scale modes (number and date only)
Section titled “Scale modes (number and date only)”Number and date filter panels have a small chevron next to the histogram toggle. Click it to reveal a three-way segmented control: lin · log · %. The three modes are mutually exclusive and the selection persists while you drag; the slider’s min/max selection is preserved across mode changes so toggling modes never loses your filter bounds.
| Mode | Number filter | Date filter |
|---|---|---|
lin (linear) | Slider position is proportional to value. Default. | Slider position is proportional to date. Default. |
log | Log-scale slider + histogram; gives the low end more resolution. Requires min ≥ 0. | Inverted log: gives the recent end more resolution (matches typical clustering-toward-now). Requires dates ≥ 1970-01-01. |
% (percentile) | Slider runs from p0 to p100. A drag to [10, 90] keeps the middle 80% of nodes by value. Tiny p{N} tags above the inputs show what percentile each handle is at. | Same percentile semantics on the date distribution. |
Each filter has its own enable checkbox at the top-left. Disabling keeps your configured values but stops the filter from participating in the match. Handy for A/B comparisons — flip one filter on and off to see its effect in isolation.
AND across all filters
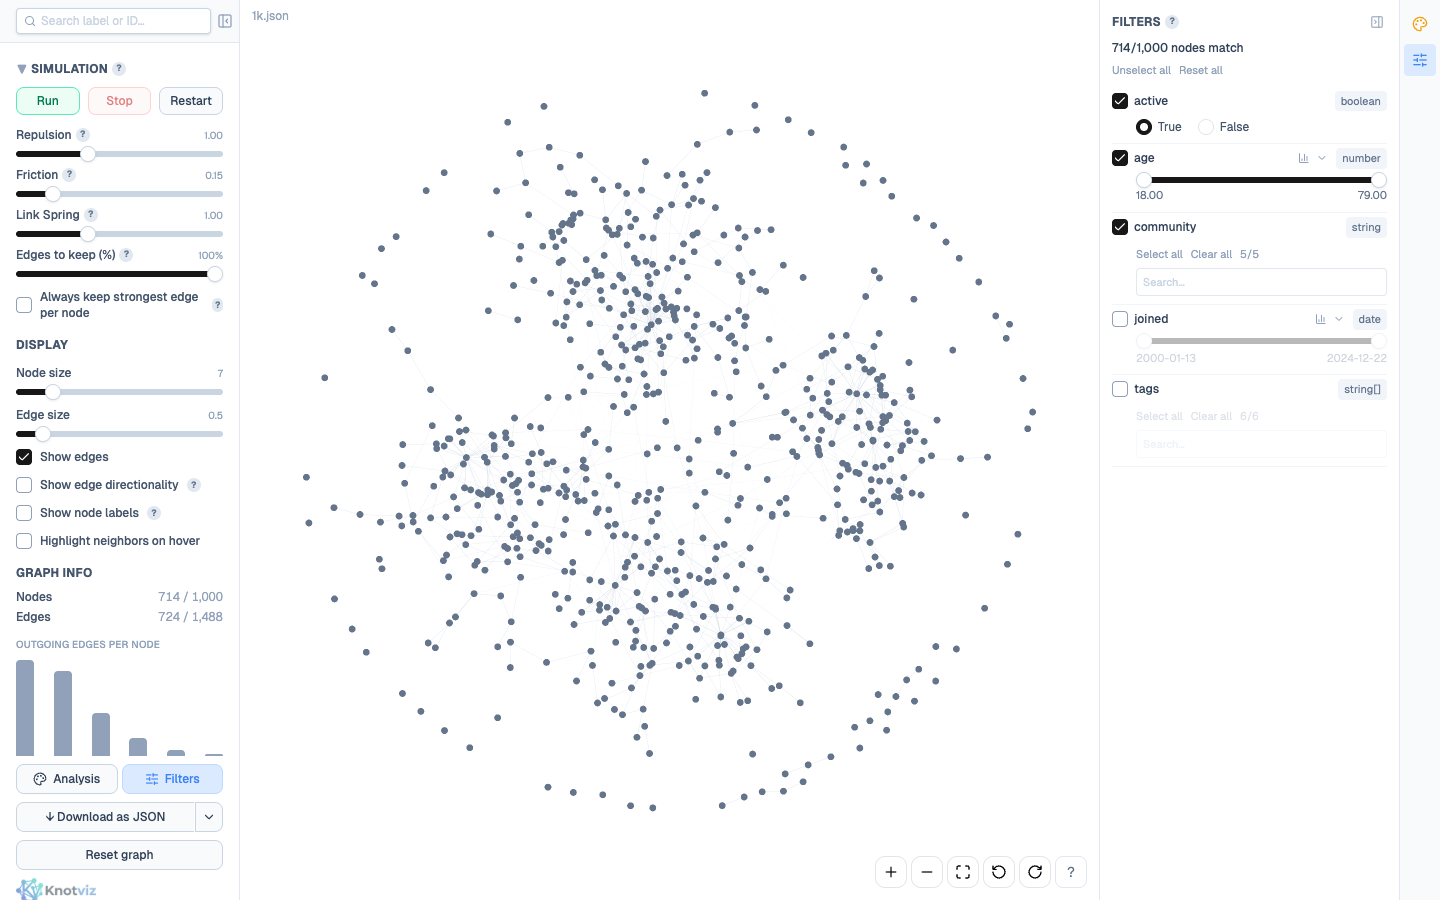
Section titled “AND across all filters”Multiple enabled filters combine with AND — a node is visible only if it matches every one of them. The match count at the top of the panel (714/1,000 nodes match) updates live as you adjust controls.
For concrete intuition: imagine filtering to age ≥ 30 AND tags includes "engineer" AND joined > 2020-01-01. A 35-year-old engineer who joined in 2022 passes all three and stays visible. A 40-year-old designer with the right join date fails the tags filter and disappears, along with every edge attached to them.
There’s no OR / NOT / XOR. Keep filters simple; combine with Search or multiple comparison passes for more complex expressions.
Hide, don’t dim
Section titled “Hide, don’t dim”Filtered-out nodes are gone, not dimmed. Every edge attached to a hidden node is also hidden; you never see “floating” edges with a missing endpoint.
That’s the deliberate split from search: filters carve the view, search dims within what’s visible. If you want to keep context and just emphasise a subset, use Search instead.
The cost of carving is you lose context: a neighbour of a visible node might be hidden, making that node look less connected than it is. Toggling the filter off and back on is cheap — use that to flip between zoomed-in and zoomed-out views of the same data.
The productive loop: filter + colour
Section titled “The productive loop: filter + colour”Filter and Analyze compose well. A typical pattern:
- Colour by a categorical property — communities, types, risk tiers. You can now see which clusters dominate.
- Filter by a numeric or boolean property —
activity > threshold,verified = true. The coloured clusters thin out; which colour survives? - Add a second filter to sharpen the question. Does the high-risk cluster mostly share one community?
Stats update live with the filter set, so the distribution you see in the Statistics panel reflects only what’s currently visible — concrete enough to notice patterns you’d miss in raw tables.
Per-filter shortcuts
Section titled “Per-filter shortcuts”- Select all / Clear all on string and string[] filters — skip the multi-click when you want everything except a handful.
- Reset per filter — returns to default (disabled, full range). Doesn’t remove the filter; you can re-enable later.
- Clear all at the top — disables every filter at once. Equivalent to starting over without losing your configured values.
Gotchas
Section titled “Gotchas”- Edges to hidden nodes disappear even if the edge itself has nothing filtered. Intentional; the alternative (orphan edges) looks broken.
logmode only unlocks when the property’s min value is in range — numbers must be ≥ 0, dates must be ≥ 1970-01-01. Out-of-range data leaves thelogbutton disabled (dimmed); stick withlinor pre-filter to the valid range.- Date
logis inverted vs numeric — it spreads out recent dates rather than early ones. Reason: most real-world date properties (signups, events, commits) cluster toward “now”, so fine-grained control belongs at the right end of the slider. If your data is the unusual shape — lots of old dates, few recent —linwill actually give you better resolution. %mode works on the dataset’s own distribution, not a global reference. If you enable a filter, narrow via other filters, then open a%slider, the percentiles still reflect the original dataset, not the currently-visible subset. (Precomputed once at load time to keep slider drags O(1).)string[]filtering uses any-match semantics — a node with tags[a, b, c]passes a filter that selectsaalone. For must-match-all-tags, add one filter per required tag.- The filter panel computes distinct values live from visible nodes, so disabling one filter may change the options available in another (the multi-select updates to reflect the now-visible set).